__PRESENT__PRESENT
__PRESENT__PRESENT__PRESENT
__PRESENT
__PRESENT

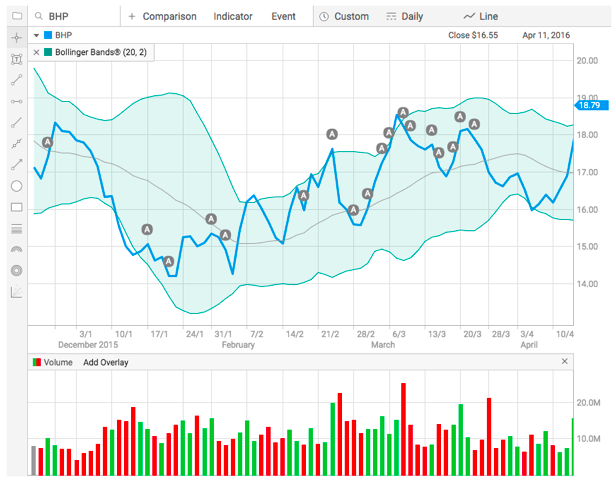
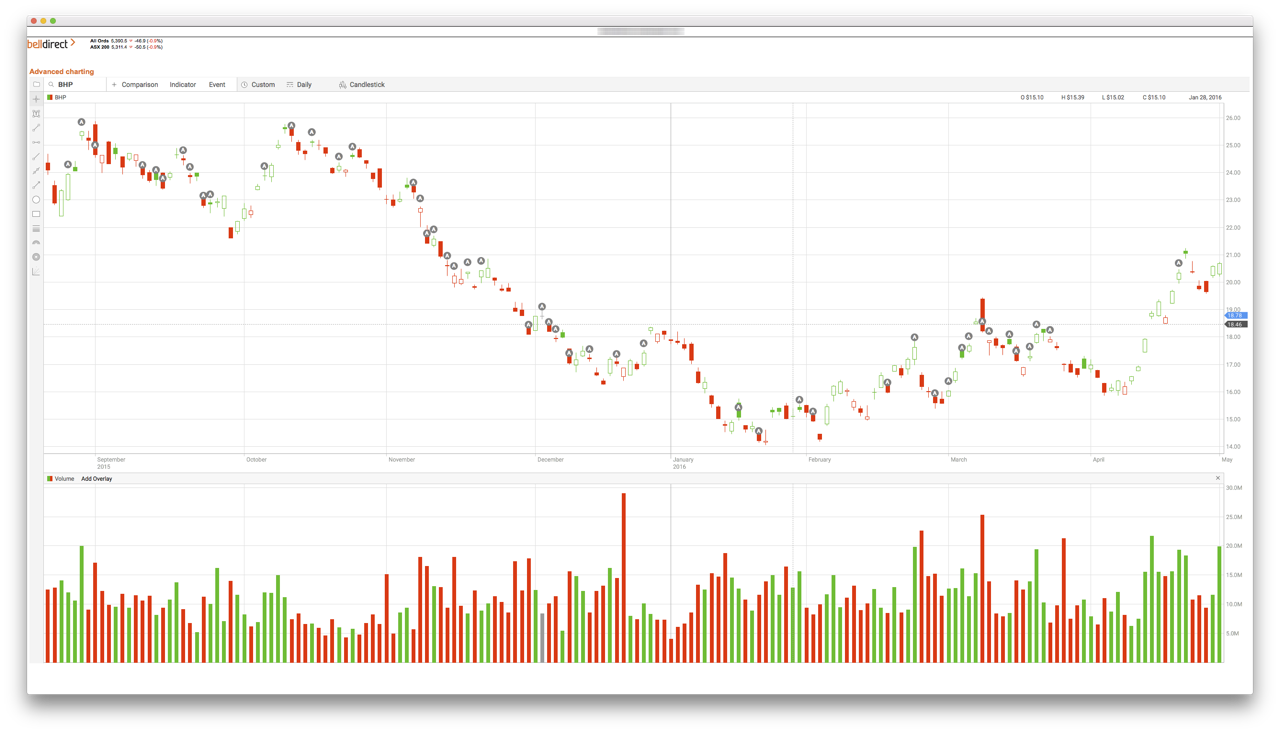
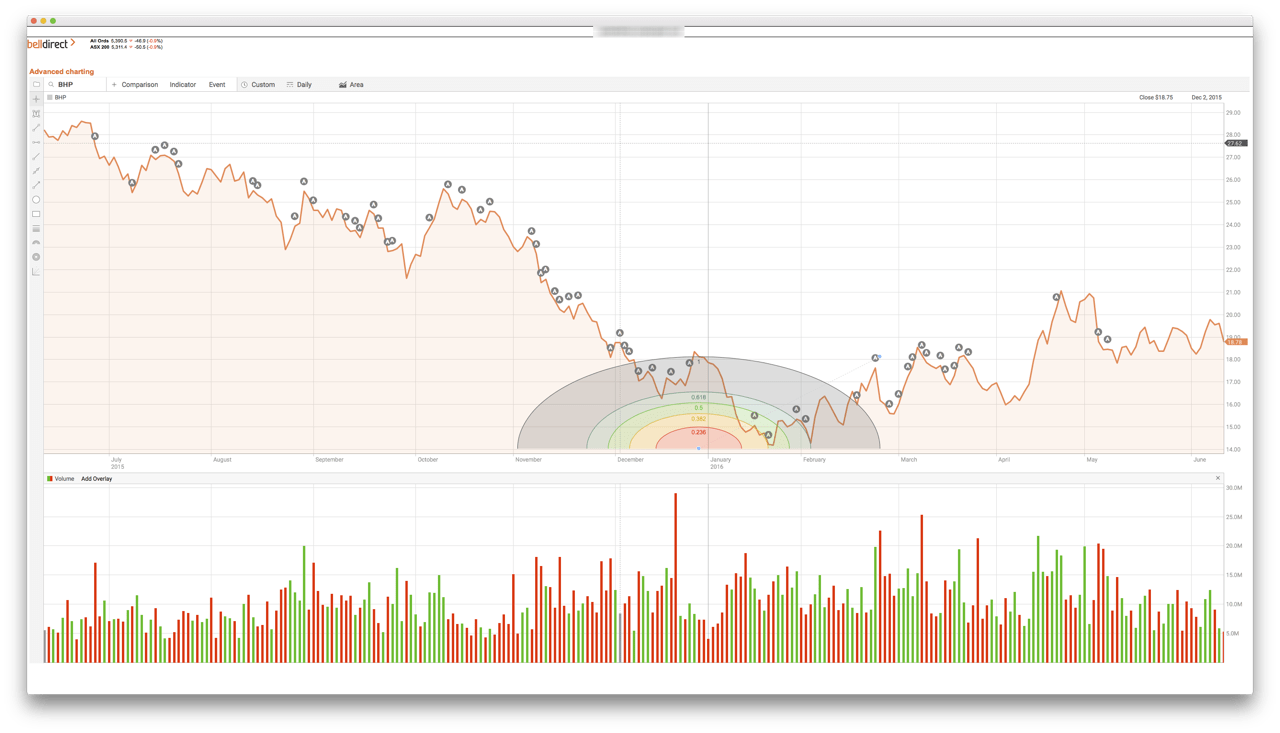
We have been working with Markit Digital to develop a new generation of charting functionality for our clients. It will help you visualise complex pricing data and technical indicators in a simple way.
With Markit’s charting solutions, you can now directly manipulate the data displayed via panning and zooming. You can also draw on, annotate and save all your charts.
With a fully responsive technology that doesn’t require any plug-ins, data and events are displayed in a clear and smart way on all your devices.
The features include:
- Fully responsive layout
- Panning and zooming of all chart data (including all indicators)
- Smart, dynamic X and Y axis labels when panning and zooming (including all indicators)
- On-the-fly backfilling of historical data when panning and zooming (including all indicators)
- Crosshair tracking and display of Open/High/Low/Close data points responding to mouse coordinate
- Clear titles, well-placed labels, proper display of key dates and comparisons across multiple time zones and exchange holidays
Markit Digital is a leading Software as a Service (SaaS) provider in the financial services industry, dedicated to the delivery and presentation of financial data and transformation of complex information.
Have a look at some examples of the new charting below:
The new charting functionality is now available on your usual ‘Chart’s icon when you log in to your Bell Direct account.